Prompt to visual
Ask for a comparison, change over time, distribution, relationship, composition, or geographic story.
Use plain language to choose a useful chart, map fields, draft annotations, and identify the clearest next question—while you remain in control of every visual decision.
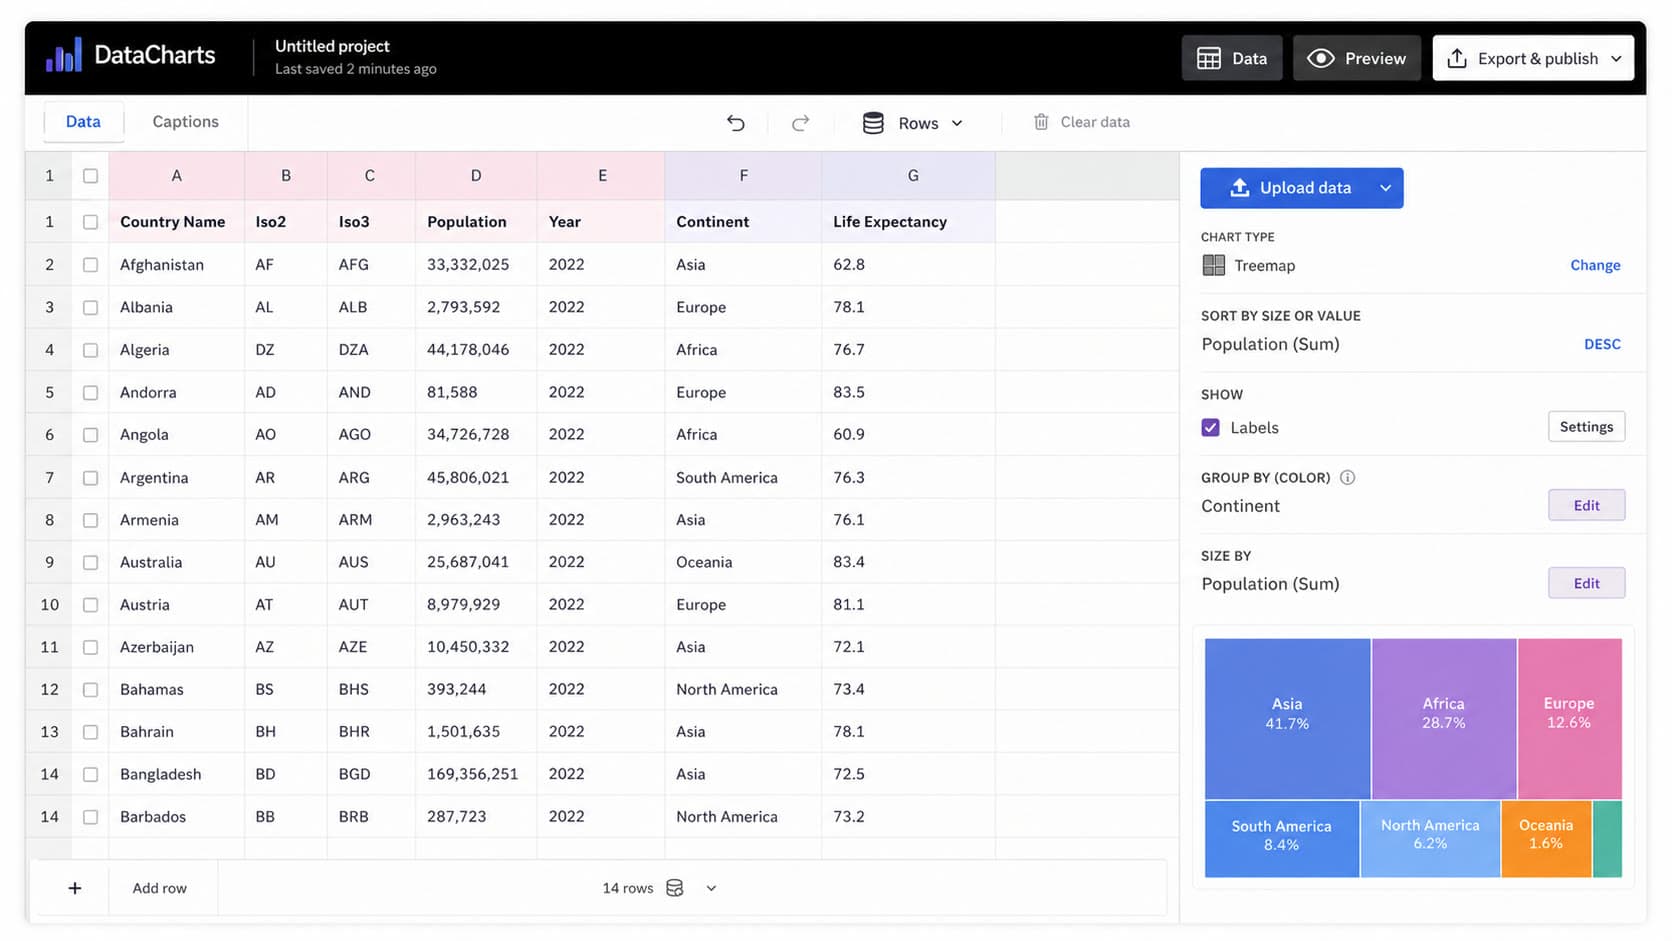
Ask for a comparison, change over time, distribution, relationship, composition, or geographic story.
Recommendations reflect field types, missing values, ranges, and the structure of your actual data.
Nothing publishes automatically. Every mapping, claim, and annotation stays visible and editable.
Bring your own dataset or start from a clean example. No credit card required.